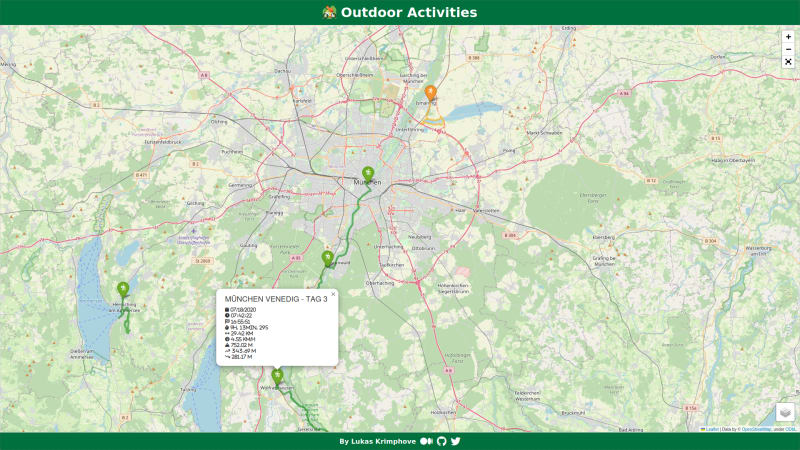
我梦想着从慕尼黑到威尼斯,徒步穿越美丽的阿尔卑斯山。但是,由于我仍然必须过我的日常生活,因此我的旅程必须由多个阶段组成,每次冒险之间,几周,几个月甚至几年。没关系,因为它比目的地更多的是旅程。但是,我一直希望有一种视觉回顾这些道路的方法,以了解我走了多远以及我与目标有多近。我想要一种庆祝自己取得的进步并激励自己进一步旅行的方法。
幸运的是,许多户外和体育应用程序,例如Adidas Running,Komoot,Strava等,慷慨地使我们能够将活动导出为GPX文件。但是,这些GPX文件无处可去。
这就是Python和Folium发挥作用的地方。我最近偶然发现了Folium,这是一个强大的Python库,用于创建交互式地图。它可以轻松地合并地理数据,例如GPX文件,并允许自定义和探索。借助我收集的大量GPS数据,我开始尝试Folium制作一张将我的户外游览带入生活的地图。
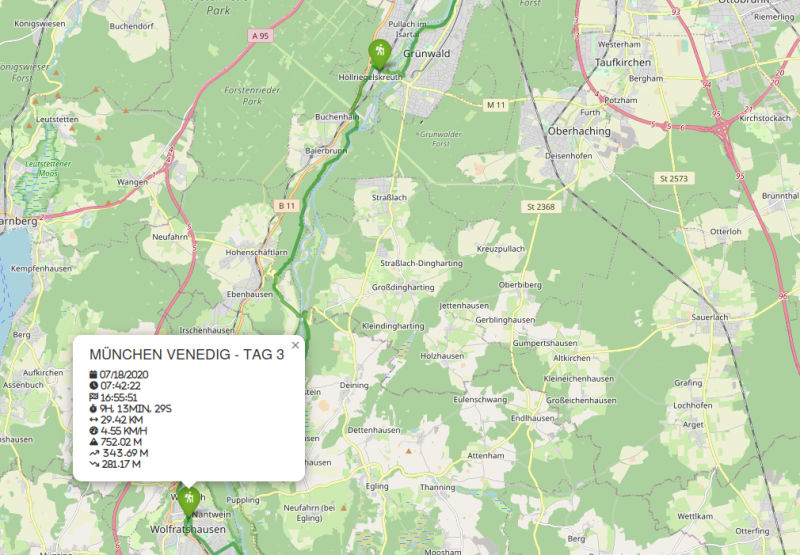
经过一些研究和大量测试,我想出了a map,使我可以重新审视过去的户外活动:
所以,如果您像我一样,并且没有任何目的的GPS数据宝藏,您可能会想知道我是怎么到达那里的。因此,在这个故事中,我将解释如何将生活呼吸到您的GPX文件中。让我们开始探索和映射的探险!
Jupyter笔记本开始
要开始这次冒险,我们将使用jupyter笔记本。为什么要木星笔记本?这是一个奇妙的交互式计算环境,使我们能够结合代码,可视化和文本,非常适合尝试我们的数据和Folium库。
如果您尚未安装Jupyter笔记本,请按照其official website上的说明进行操作。安装后,您可以创建一个新的Jupyter笔记本并为您的旅程做准备。
解析GPX文件以获取跟踪数据
接下来,我们需要地图的原材料 - GPX文件。 GPX (GPS Exchange Format)是一种广泛使用的文件格式,它存储位置数据,例如纬度,经度,高程和时间,是跟踪室外活动的理想之选。
如果您是一个狂热的徒步旅行者,跑步者,骑自行车的人或滑雪者,那么您的机会已经很有可能使用室外或体育应用程序跟踪了各种游览。这些应用程序中的大量应用程序允许您以GPX格式导出活动。因此,收集这些GPX文件,让我们开始!
在我们的Python代码中,我们将使用GPXPY库来解析GPX文件并提取基本跟踪数据,例如纬度,经度,高程,速度和距离。 parse_gpx()函数将为我们做所有繁重的举重:
### READ GPX FILES

import gpxpy
import pandas as pd
import numpy as np
import haversine as hs
from pathlib import Path


def parse_gpx(file_path):
    # parse gpx file to pandas dataframe
    gpx = gpxpy.parse(open(file_path), version='1.0')

    data = []
    points = []
    for track in gpx.tracks:
        for segment in track.segments:
            for point_idx, point in enumerate(segment.points):
                points.append(tuple([point.latitude, point.longitude]))

                # calculate distances between points
                if point_idx == 0:
                    distance = np.nan
                else:
                    distance = hs.haversine(
                        point1=points[point_idx-1],
                        point2=points[point_idx],
                        unit=hs.Unit.METERS
                    )

                data.append([point.longitude, point.latitude,point.elevation, point.time, segment.get_speed(point_idx), distance])

    columns = ['Longitude', 'Latitude', 'Elevation', 'Time', 'Speed', 'Distance']
    gpx_df = pd.DataFrame(data, columns=columns)

    return points, gpx_df


activities = {}
frames = []
for activity_type in ACTIVITY_TYPES:
    activities[activity_type] = {}

    pathlist = Path(activity_type).glob('**/*.gpx')
    for path in pathlist:
        # exclude hidden directories and files
        # will lead to performance issues if there are lots of hidden files
        if any(part.startswith('.') for part in path.parts):
            continue

        activity_group = path.parts[1]
        activity_name = path.parts[2]

        if activity_group not in activities[activity_type]:
            activities[activity_type][activity_group] = []

        points, gpx_df = parse_gpx(path)

        gpx_df['Elevation_Diff'] = np.round(gpx_df['Elevation'].diff(), 2)
        gpx_df['Cum_Elevation'] = np.round(gpx_df['Elevation_Diff'].cumsum(), 2)
        gpx_df['Cum_Distance'] = np.round(gpx_df['Distance'].cumsum(), 2)
        gpx_df['Gradient'] = np.round(gpx_df['Elevation_Diff'] / gpx_df['Distance'] * 100, 1)

        activities[activity_type][activity_group].append({
            'name': activity_name.replace('.gpx', '').replace('_', ' '),
            'points': points,
            'gpx_df': gpx_df
        })
        frames.append(gpx_df)

df = pd.concat(frames)
df
使我们拥有一项活动的所有必要数据:所有GPS坐标的列表和包含各种指标的PANDAS数据框架。
在交互式地图上绘制GPX步道
通过现在在熊猫数据框架中组织的GPS数据,我们可以在交互式地图上可视化我们的户外活动。 Folium使这项任务变得轻而易举:
### CONFIG

# LOCATION = None
LOCATION = [48.13743, 11.57549] # latitude, longitude
ZOOM_START = 10

ACTIVITY_TYPES = {
    'Hiking': {
        'icon': 'person-hiking',
        'color': 'green'
    },
    'Running': {
        'icon': 'person-running',
        'color': 'orange'
    },
    'Biking': {
        'icon': 'person-biking',
        'color': 'red'
    },
    'Skiing': {
        'icon': 'person-skiing',
        'color': 'blue'
    }
}
-
我们将创建一个以特定位置为中心的地图(您可以选择一个地图,或者让代码根据数据确定中心)。
-
我们将为每种活动类型(例如远足,跑步,骑自行车或滑雪)分配独特的颜色和图标。 activy_types词典将帮助我们解决这个问题。
### CREATE MAP

import folium
from folium import plugins as folium_plugins

if LOCATION:
    location = LOCATION
else:
    location=[df.Latitude.mean(), df.Longitude.mean()]

map = folium.Map(location=location, zoom_start=ZOOM_START, tiles=None)
folium.TileLayer('OpenStreetMap', name='OpenStreet Map').add_to(map)
folium.TileLayer('Stamen Terrain', name='Stamen Terrain').add_to(map)


### MAP TRAILS

def timedelta_formatter(td):
    td_sec = td.seconds
    hour_count, rem = divmod(td_sec, 3600)
    hour_count += td.days * 24
    minute_count, second_count = divmod(rem, 60)
    return f'{hour_count}h, {minute_count}min, {second_count}s'

def create_activity_popup(activity):
    df = activity['gpx_df']
    attributes = {
        'Date': {
            'value': df['Time'][df.index[0]].strftime("%m/%d/%Y"),
            'icon': 'calendar'
        },
        'Start': {
            'value': df['Time'][df.index[0]].strftime("%H:%M:%S"),
            'icon': 'clock'
        },
        'End': {
            'value': df['Time'][df.index[-1]].strftime("%H:%M:%S"),
            'icon': 'flag-checkered'
        },
        'Duration': {
            'value': timedelta_formatter(df['Time'][df.index[-1]]-df['Time'][df.index[0]]),
            'icon': 'stopwatch'
        },
        'Distance': {
            'value': f"{np.round(df['Cum_Distance'][df.index[-1]] / 1000, 2)} km",
            'icon': 'arrows-left-right'
        },
        'Average Speed': {
            'value': f'{np.round(df.Speed.mean() * 3.6, 2)} km/h',
            'icon': 'gauge-high'
        },
        'Max. Elevation': {
            'value': f'{np.round(df.Elevation.max(), 2)} m',
            'icon': 'mountain'
        },
        'Uphill': {
            'value': f"{np.round(df[df['Elevation_Diff']>0]['Elevation_Diff'].sum(), 2)} m",
            'icon': 'arrow-trend-up'
        },
        'Downhill': {
            'value': f"{np.round(abs(df[df['Elevation_Diff']<0]['Elevation_Diff'].sum()), 2)} m",
            'icon': 'arrow-trend-down'
        },
    }
    html = f"<h4>{activity['name'].upper()}</h4>"
    for attribute in attributes:
        html += f'<i class="fa-solid fa-{attributes[attribute]["icon"]}" title="{attribute}">  {attributes[attribute]["value"]}</i></br>'
    return folium.Popup(html, max_width=300)

feature_groups = {}
for activity_type in activities:
    color = ACTIVITY_TYPES[activity_type]['color']
    icon = ACTIVITY_TYPES[activity_type]['icon']

    for activity_group in activities[activity_type]:
        # create and store feature groups
        # this allows different activity types in the same feature group
        if activity_group not in feature_groups:
            # create new feature group
            fg = folium.FeatureGroup(name=activity_group, show=True)
            feature_groups[activity_group] = fg
            map.add_child(fg)
        else:
            # use existing
            fg = feature_groups[activity_group]

        for activity in activities[activity_type][activity_group]:
            # create line on map
            points = activity['points']
            line = folium.PolyLine(points, color=color, weight=4.5, opacity=.5)
            fg.add_child(line)

            # create marker
            marker = folium.Marker(points[0], popup=create_activity_popup(activity),
                                   icon=folium.Icon(color=color, icon_color='white', icon=icon, prefix='fa'))
            fg.add_child(marker)

map.add_child(folium.LayerControl(position='bottomright'))
folium_plugins.Fullscreen(position='topright').add_to(map)
map
-
我们将使用Foliums功能组概念来根据其组名称进行小径进行分组。这将使我们以后显示和隐藏某些活动组。
-
现在,我们将通过分析的数据迭代,并使用Folium的Polyline和Marker对象在地图上绘制每个跟踪。多线线将代表实际的跟踪,而标记将充当每个活动的起点。单击标记时,弹出窗口将显示有关相应跟踪的相关信息。
结论
在探索和映射的旅程中,我们学会了如何使用Python和Folium将平凡的GPX文件转换为动态和交互式地图。现在,您可以重温户外冒险,庆祝您的进步并在下一阶段的旅途中保持动力。
但是,有很多方法可以自定义,扩展和改进地图。因此,抓住您的GPX文件,启动Jupyter笔记本,让您过去的户外活动在地图上栩栩如生!
快乐的映射!
接下来是什么?
请继续关注,因为还有更多:
-
使用AWS使用AWS
部署网站
-
使用Python和Plotly
绘制高程和速度剖面
-
用图片拍摄的图片
增强步道
-
和更多
参考
-
所有代码,包括jupyter笔记本,都在my GitHub上。
-
在进行我的folium研究时,我发现了帕特里克(Patrick)的a great story,他做了我计划做的同样的事情。他的工作是建立在我的解决方案上的绝佳基础,所以请检查一下。
本文是originally published in "Python in Plain English" on Medium。

