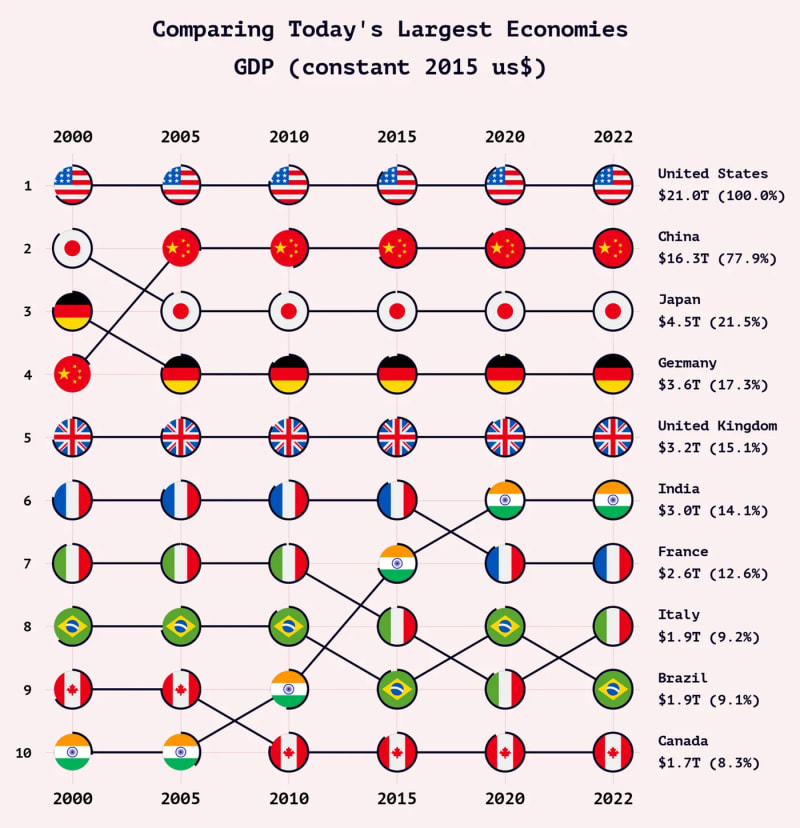
嗨,欢迎来到本教程,我会教您使用Python和Matplotlib创建一个国家排名图表。
我喜欢这种可视化的是它的清洁和美丽的方式,显示各国在特定指标上的排名如何。
使用标准线图的替代方法显示,如果某些国家彼此靠近,或者某些国家的表现胜过很多。
如果您想访问本教程的代码,则可以在此GitHub repository中找到它。
如果您喜欢本教程,请确保查看我的其他帐户。
- Data Wonder在替代上
- Twitter上的oscarl3o
- oscarleo中
让我们开始。
关于数据
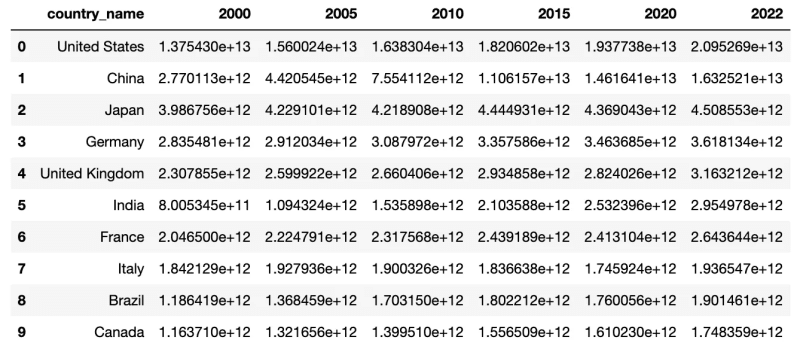
我创建了一个简单的CSV,该CSV包含当今的十个最大经济体的GDP值。
数据来自World Bank,指标的全名为“ GDP(Constant 2015 US $)”。
如果您想了解更多有关测量GDP的方法,则可以查看此Medium story,我使用相同类型的数据可视化。
让我们继续进行教程。
步骤1:创建排名
第一步是在数据集中每年对国家进行排名,这很容易与熊猫一起做。
def create_rankings(df, columns):
    rank_columns = ["rank_{}".format(i) for i in range(len(columns))]
    for i, column in enumerate(columns):
        df[rank_columns[i]] = df[column].rank(ascending=False)

    return df, rank_columns
结果列看起来像这样。
这就是我们需要继续进行数据可视化的所有预处理。
步骤2:创建和造型网格
现在我们已经准备好数据了,现在该创建一个网格,我们可以在其中绘制线条和标志。
这是一种使用Seaborn创建整体风格的功能。它定义了背景色和字体系列之类的东西。我还去除刺和tick虫。
def set_style(font_family, background_color, grid_color, text_color):
    sns.set_style({
        "axes.facecolor": background_color,
        "figure.facecolor": background_color,

        "axes.grid": True,
        "axes.axisbelow": True,

        "grid.color": grid_color,

        "text.color": text_color,
        "font.family": font_family,

        "xtick.bottom": False,
        "xtick.top": False,
        "ytick.left": False,
        "ytick.right": False,

        "axes.spines.left": False,
        "axes.spines.bottom": False,
        "axes.spines.right": False,
        "axes.spines.top": False,
    }
)
我以以下值运行该函数。
font_family = "PT Mono"
background_color = "#FAF0F1"
text_color = "#080520"
grid_color = "#E4C9C9"

set_style(font_family, background_color, grid_color, text_color)
为了创建实际的网格,我具有一个格式化y-和x轴的函数。它需要一些参数,使我可以尝试不同的设置,例如标签的大小。
def format_ticks(ax, years, padx=0.25, pady=0.5, y_label_size=20, x_label_size=24):
    ax.set(xlim=(-padx, len(years) -1 + padx), ylim=(-len(df) - pady, - pady))

    xticks = [i for i in range(len(years))]
    ax.set_xticks(ticks=xticks, labels=years)

    yticks = [-i for i in range(1, len(df) + 1)]
    ylabels = ["{}".format(i) for i in range(1, len(df) + 1)]
    ax.set_yticks(ticks=yticks, labels=ylabels)

    ax.tick_params("y",labelsize=y_label_size, pad=16)
    ax.tick_params("x", labeltop=True, labelsize=x_label_size, pad=8)
当我运行到到目前为止的一切时,它是什么样子。
# Load data
years = ["2000", "2005", "2010", "2015", "2020", "2022"]
df = pd.read_csv("rankings.csv", index_col=None)
df, rank_columns = create_rankings(df, years)

# Create chart
fig, ax = plt.subplots(nrows=1, ncols=1, figsize=(15, 1.6*len(df)))
format_ticks(ax, years)
,这是由此产生的网格。
现在我们可以开始添加一些数据。
步骤3:添加行
我想要一行在数据集中显示每个国家 /地区的排名。
def add_line(ax, row, columns, linewidth=3):
    x = [i for i in range(len(columns))]
    y = [-row[rc] for rc in columns]

    ax.add_artist(
        Line2D(x, y, linewidth=linewidth, color=text_color)
    )
然后我在数据集中的每一行运行函数。
# Load data
years = ["2000", "2005", "2010", "2015", "2020", "2022"]
df = pd.read_csv("rankings.csv", index_col=None)
df, rank_columns = create_rankings(df, years)

# Create chart
fig, ax = plt.subplots(nrows=1, ncols=1, figsize=(15, 1.6*len(df)))
format_ticks(ax, years)

# Draw lines
for i, row in df.iterrows():
    add_line(ax, row, rank_columns)
我对每行使用相同的颜色,因为我想使用乡村标志来指导眼睛。为每行使用独特的颜色是有道理的,但看起来很混乱。
步骤4:绘制饼图
我想指出一个国家的经济在不添加文本的情况下如何随着时间的流逝而增长。相反,我的目标是以视觉格式告知
我的想法是在每个点上绘制一个饼图,显示一个国家经济的规模与最佳一年相比。
我使用pil创建饼图图像,但是您可以直接使用matplotlib。我没有因为我有一些纵横比的问题。
def add_pie(ax, x, y, ratio, size=572, zoom=0.1):
    image = Image.new('RGBA', (size, size))
    draw = ImageDraw.Draw(image)

    draw.pieslice((0, 0, size, size), start=-90, end=360*ratio-90, fill=text_color, outline=text_color)
    im = OffsetImage(image, zoom=zoom, interpolation="lanczos", resample=True, visible=True)

    ax.add_artist(AnnotationBbox(
        im, (x, y), frameon=False,
        xycoords="data",
    ))
大小参数的值略大于我的标志图像的大小为512x512。后来,我想在饼图上粘贴旗帜。
这是更新的代码。
# Load data
years = ["2000", "2005", "2010", "2015", "2020", "2022"]
df = pd.read_csv("rankings.csv", index_col=None)
df, rank_columns = create_rankings(df, years)

# Create chart
fig, ax = plt.subplots(nrows=1, ncols=1, figsize=(15, 1.6*len(df)))
format_ticks(ax, years)

# Draw lines
for i, row in df.iterrows():
    add_line(ax, row, rank_columns)

    for j, rc in enumerate(rank_columns):
        add_pie(ax, j, -row[rc], ratio=row[years[j]] / row[years].max())
,结果是结果。
开始看起来很有帮助,所以该使它变得美丽了。
步骤5:添加标志
我喜欢在图表中使用旗帜,因为它们很漂亮。
在这里,旗帜的目的是使图表在视觉上吸引人,解释我们要查看的哪个国家,并指导着眼睛。
我正在使用这些rounded flags。它们需要许可证,因此,不幸的是,我可以分享它们,但是您可以在其他地方找到类似的标志。
我遇到了一些问题,可以使派和标志完美地对齐,因此我没有创建单独的函数来添加标志,而是重写add_pie()函数。
def add_pie_and_flag(ax, x, y, name, ratio, size=572, zoom=0.1):
    flag = Image.open("<location>/{}.png".format(name.lower()))
    image = Image.new('RGBA', (size, size))
    draw = ImageDraw.Draw(image)
    pad = int((size - 512) / 2)

    draw.pieslice((0, 0, size, size), start=-90, end=360*ratio-90, fill=text_color, outline=text_color)
    image.paste(flag, (pad, pad), flag.split()[-1])

    im = OffsetImage(image, zoom=zoom, interpolation="lanczos", resample=True, visible=True)

    ax.add_artist(AnnotationBbox(
        im, (x, y), frameon=False,
        xycoords="data",
    ))
我在饼图功能之后立即添加。
# Load data
years = ["2000", "2005", "2010", "2015", "2020", "2022"]
df = pd.read_csv("rankings.csv", index_col=None)
df, rank_columns = create_rankings(df, years)

# Create chart
fig, ax = plt.subplots(nrows=1, ncols=1, figsize=(15, 1.6*len(df)))
format_ticks(ax, years)

# Draw lines
for i, row in df.iterrows():
    add_line(ax, row, rank_columns)

    for j, rc in enumerate(rank_columns):
        add_pie_and_flag(
            ax, j, -row[rc],
            name=row.country_name,
            ratio=row[years[j]] / row[years].max()
        )
现在,您可以看到使用标志的视觉魔法。与以前的输出相比,这是一个很大的差异。
我们突然有看起来不错并且易于理解的东西。最后要做的是添加一些有用的信息。
步骤5:添加其他信息
并非每个人都知道所有的旗帜,所以我想在右边添加这个国家的名字。
我还想展示经济的规模以及每个国家与最高排名的比较。
这是我这样做的代码。
def add_text(ax, value, max_value, y):
    trillions = round(value / 1e12, 1)
    ratio_to_max = round(100 * value / max_value, 1)

    text = "{}\n${:,}T ({}%)".format(
        row.country_name,
        trillions,
        ratio_to_max
    )

    ax.annotate(
        text, (1.03, y),
        fontsize=20,
        linespacing=1.7,
        va="center",
        xycoords=("axes fraction", "data")
    )
和以前一样,我将功能添加到主代码块中。请注意,我还添加了标题。
years = ["2000", "2005", "2010", "2015", "2020", "2022"]
df = pd.read_csv("rankings.csv", index_col=None)
df, rank_columns = create_rankings(df, years)

fig, ax = plt.subplots(nrows=1, ncols=1, figsize=(15, 1.6*len(df)))
format_ticks(ax, years)

for i, row in df.iterrows():
    add_line(ax, row, rank_columns)

    for j, rc in enumerate(rank_columns):
        add_pie_and_flag(
            ax, j, -row[rc],
            name=row.country_name,
            ratio=row[years[j]] / row[years].max()
        )

    add_text(ax, value=row[years[-1]], max_value=df.iloc[0][years[-1]], y=-(i + 1))
    plt.title("Comparing Today's Largest Economies\nGDP (constant 2015 us$)", linespacing=1.8, fontsize=32, x=0.58, y=1.12)
voila。
是这样;我们完成了。
结论
今天,您学习了一种可视化的替代方法。
我喜欢这种类型的数据可视化,因为它很容易在眼睛上传达大量信息。
如果您和我一样喜欢它,请确保订阅我的频道以获取更多相同的内容! :)
谢谢您的阅读。


