背景
由于通货膨胀和经济衰退的持续发生,这是一件压力很大的事情。但是,要解决这种压力很大的风景,有一种解决方案可以跟踪我们的预算并以极大的方式管理资金。因此,我想到创建此费用跟踪Web应用程序,这将有助于跟踪每月的费用。
我建造的
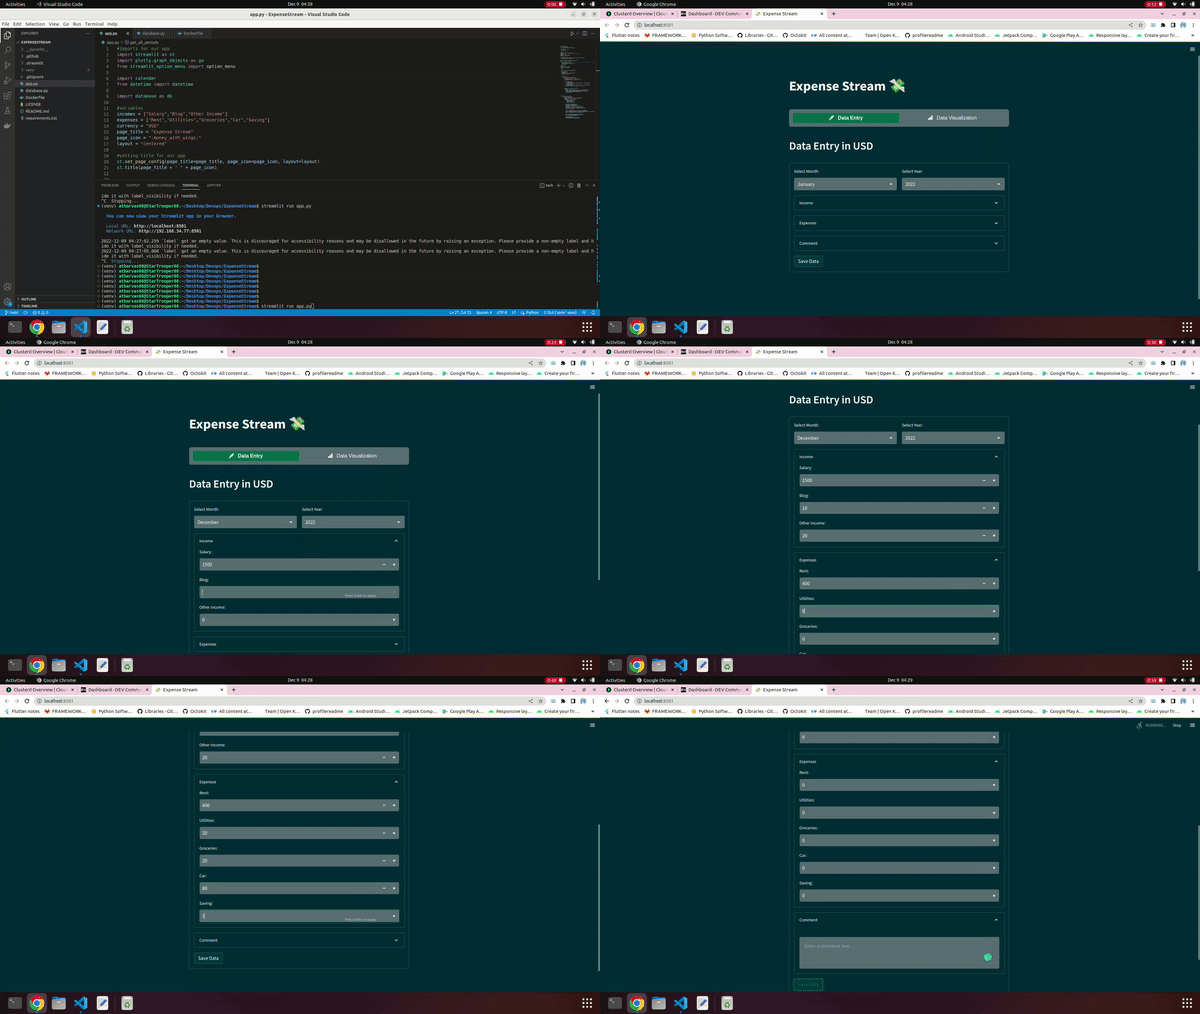
我已经使用Spartlit和MongoDB Atlas群集构建了此Web应用程序来存储数据。它采用类似于总收入的投入,是的,甚至将我们的支出和必要的支出作为输入,然后将其存储到MongoDB数据库中。
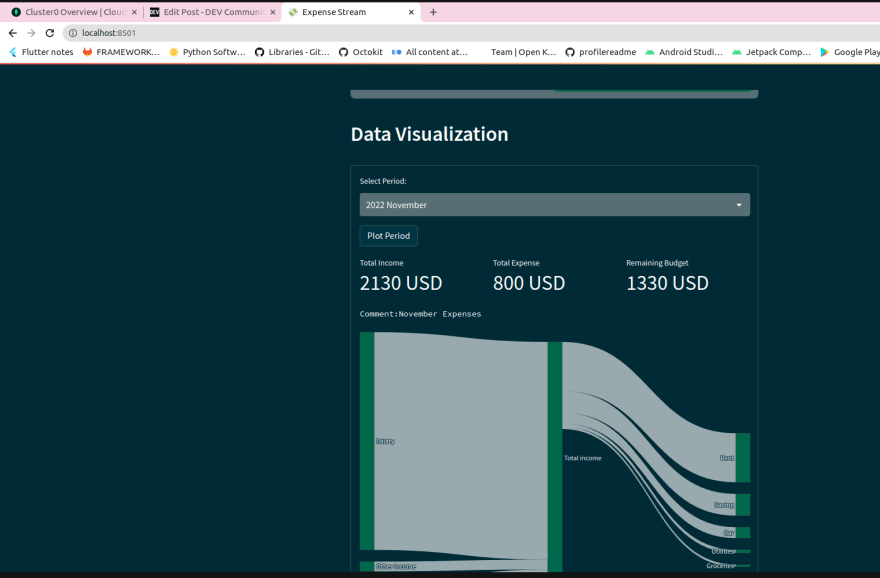
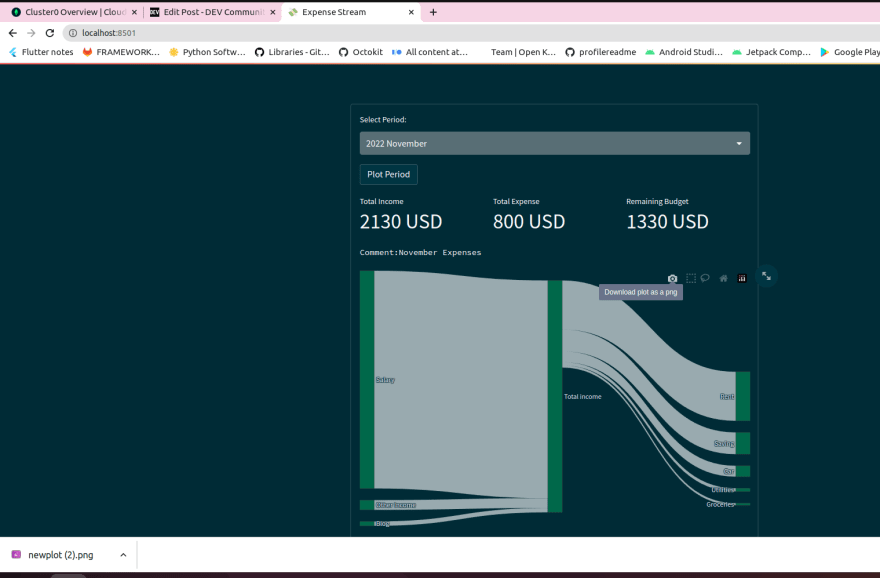
当我们想查找数据时,我们可以以Nice Sankey图表形式可视化。 Sankey图表显示了收入和支出的流程。
类别提交:
在JS框外思考
应用链接
https://expensestream.azurewebsites.net/
屏幕截图
将图表保存为PNG图像功能:
描述
帮助您跟踪收入和支出。
链接到源代码
允许许可证
MIT许可证
我如何建造它
(您是如何利用Mongodb地图集的?
发展过程:
设置和启动虚拟环境
- 使用readme.md和许可证文件创建空的github存储库。
- 克隆本地存储库
git clone https://github.com/StarTrooper08/ExpenseStream.git - CD到项目文件并启动Virtual Env
- gitignore venv文件夹,这样我们就不要将VENV目录推向github repo
- 安装Python库 python库:shatlit,plotly,pymongo and streamlit_option_menu
pip install streamlit plotly pymongo streamlit_option_menu
编码部分:
对于此应用程序,我们将创建两个python文件一个是app.py,我们的前端代码以及将与数据库文件交互以添加和获取MongoDB数据库的数据。和其他文件名database.py将专门用于创建数据库函数,该功能将帮助我们在集合中创建文档并在app.py文件中调用文档。
现在让我们在我们的费用流目录中创建app.py并编写一些代码
app.py文件
#imports for our app
import streamlit as st
import plotly.graph_objects as go
from streamlit_option_menu import option_menu

import calendar
from datetime import datetime

import database as db

#variables
incomes = ["Salary","Blog","Other Income"]
expenses = ["Rent","Utilities","Groceries","Car","Saving"]
currency = "USD"
page_title = "Expense Stream"
page_icon = ":money_with_wings:"
layout = "centered"

#setting title for our app
st.set_page_config(page_title=page_title, page_icon=page_icon, layout=layout)
st.title(page_title + " " + page_icon)


years = [datetime.today().year, datetime.today().year + 1]
months = list(calendar.month_name[1:])

def get_all_periods():
    items = db.fetch_all_periods()
    periods = [item["key"] for item in items]
    return periods

hide_st_style = """
<style>
#MainMenu {visiblility: hidden;}
footer {visiblility: hidden;}
header {visiblility: hidden;}
</style>
"""

st.markdown(hide_st_style,unsafe_allow_html=True)

selected = option_menu(
    menu_title= None,
    options=["Data Entry","Data Visualization"],
    icons=["pencil-fill","bar-chart-fill"],
    orientation= "horizontal",
)


if selected == "Data Entry":
        st.header(f"Data Entry in {currency}")
        with st.form("Entry_form", clear_on_submit=True):
            col1, col2 = st.columns(2)
            col1.selectbox("Select Month:", months, key= "month")
            col2.selectbox("Select Year:", years, key="year")


            with st.expander("Income"):
                for income in incomes:
                    st.number_input(f"{income}:",min_value=0, format="%i", step=10,key=income)
            with st.expander("Expenses"):
                for expense in expenses:
                    st.number_input(f"{expense}:", min_value=0,format="%i",step=10,key=expense)
            with st.expander("Comment"):
                comment = st.text_area("", placeholder="Enter a comment hee ...")


            submitted = st.form_submit_button("Save Data")
            if submitted:
                period = str(st.session_state["year"]) + " " + str(st.session_state["month"])
                incomes = {income: st.session_state[income] for income in incomes}
                expenses = {expense: st.session_state[expense] for expense in expenses}
                db.insert_period(period,incomes,expenses,comment)
                st.success("Data Saved!")


if selected == "Data Visualization":
        st.header("Data Visualization")
        with st.form("Saved periods"):
            period = st.selectbox("Select Period:", get_all_periods())
            submitted = st.form_submit_button("Plot Period")
            if submitted:
                period_data = db.get_period(period)
                for doc in period_data:
                    comment = doc["comment"]
                    expenses = doc["expenses"]
                    incomes = doc["incomes"]


                total_income = sum(incomes.values())
                total_expense = sum(expenses.values())
                remaining_budget = total_income - total_expense
                col1, col2, col3 = st.columns(3)
                col1.metric("Total Income",f"{total_income} {currency}")
                col2.metric("Total Expense",f"{total_expense} {currency}")
                col3.metric("Remaining Budget",f"{remaining_budget} {currency}")
                st.text(f"Comment:{comment}")


                label = list(incomes.keys()) + ["Total income"] + list(expenses.keys())
                source = list(range(len(incomes))) + [len(incomes)] * len(expenses)
                target = [len(incomes)] * len(incomes) + [label.index(expense) for expense in expenses.keys()]
                value = list(incomes.values()) + list(expenses.values())


                link = dict(source=source, target=target,value=value)
                node = dict(label=label,pad=20,thickness=25,color="#00684A")
                data = go.Sankey(link=link,node=node)

                fig = go.Figure(data)
                fig.update_layout(margin=dict(l=0,r=0,t=5,b=5))
                st.plotly_chart(fig, use_container_width=True)
我们可以使用简易config toml文件为我们的应用程序提供主题,这将使我们的应用程序设计看起来很棒且一致。
首先,我们将在我们的父项目目录中创建.streamlit/config.toml目录。
.streamlit/config.toml
[theme]

primaryColor = "#00684A"

backgroundColor = "#002b36"

secondaryBackgroundColor = "#586e75"

textColor = "#fafafa"

font ="sans serif"
我们创建数据库。PY文件并将代码写入其中之前,请让我们设置MongoDB群集以供我们使用。
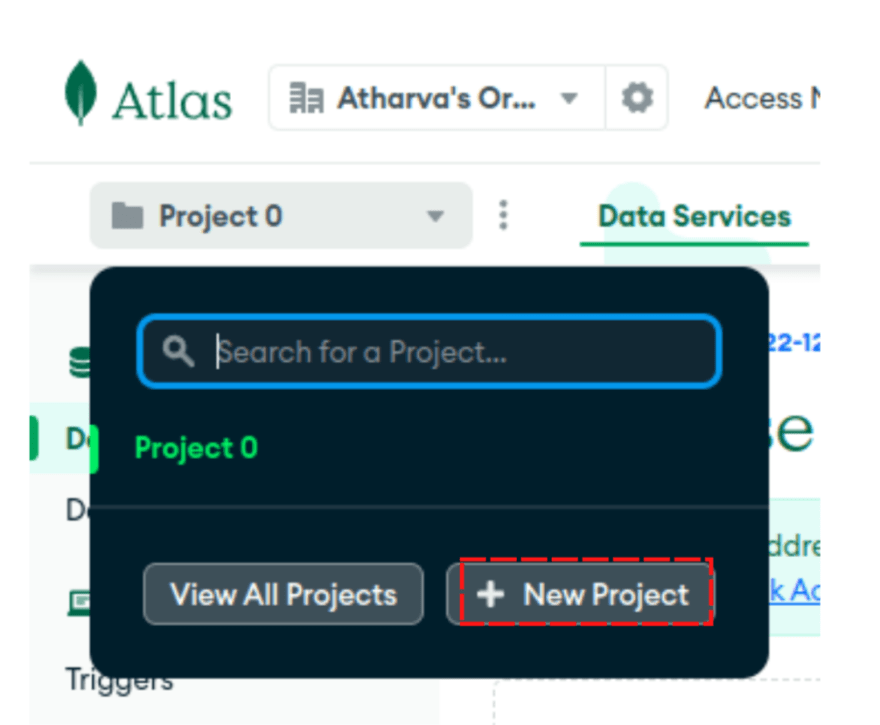
- 首次单击项目下拉列表,您将找到您现有的项目,但是我们要创建新项目,我们将单击新项目,然后我们将要求将成员添加到我们的群集中,但我们将保持原样和前进。
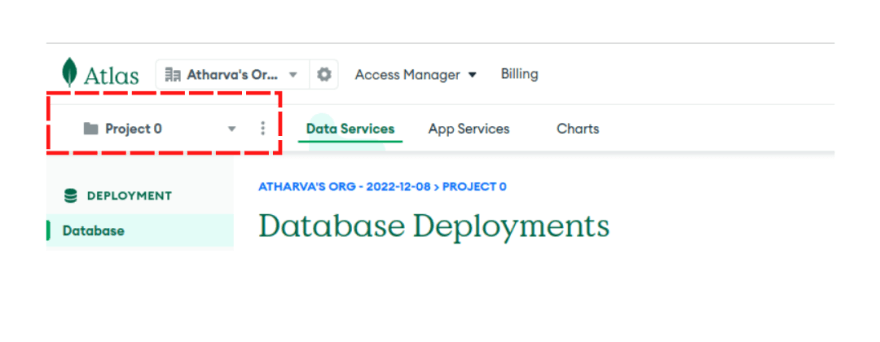
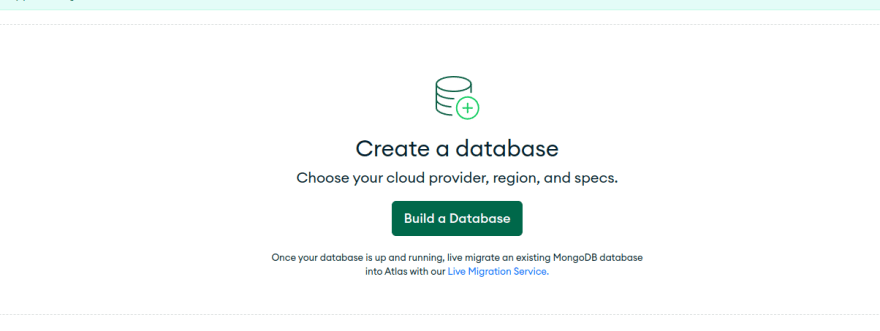
- 之后,我们将单击创建数据库。
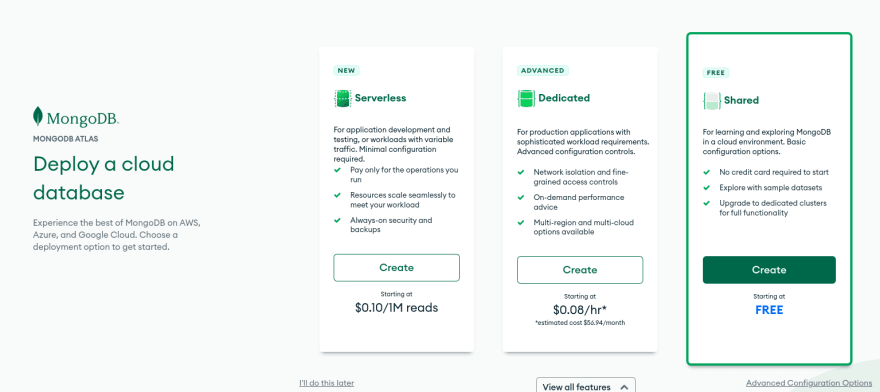
- 然后选择部署选项我们将选择免费级别,因为这只是一个演示应用程序。
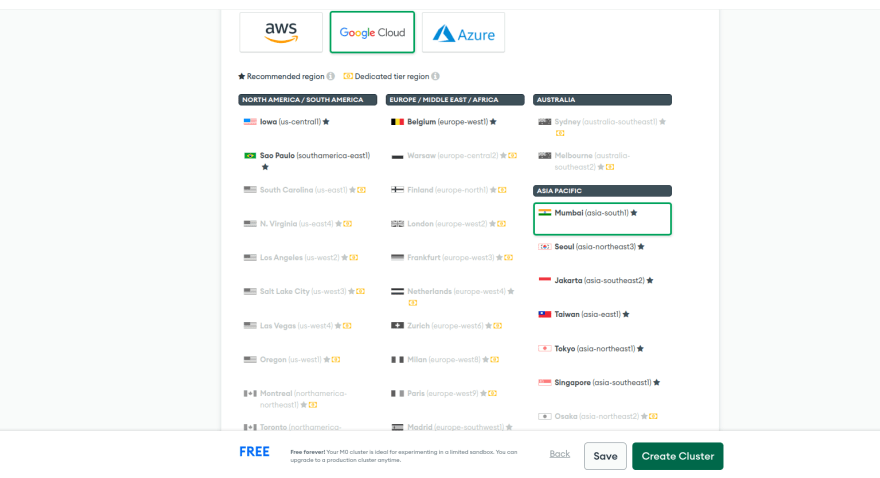
- 选择群集的云提供商和区域。在这里,我正在选择GCP和我最喜欢的区域,该区域要靠近我。选择云提供商和区域后,单击创建集群。
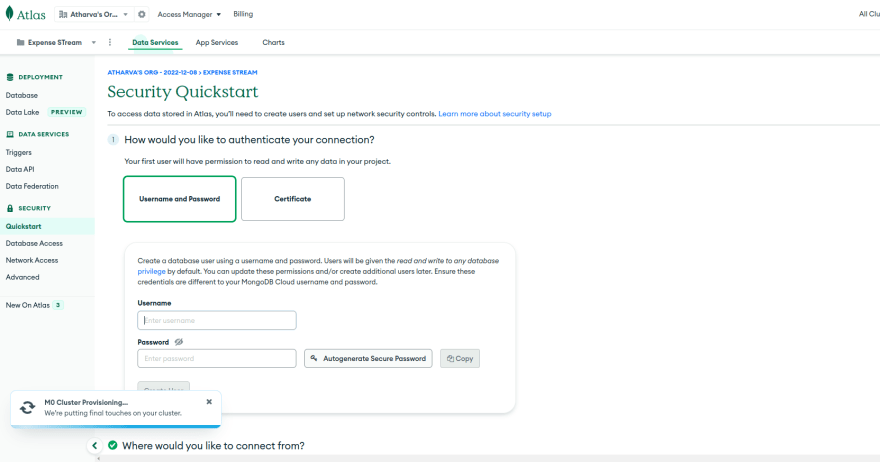
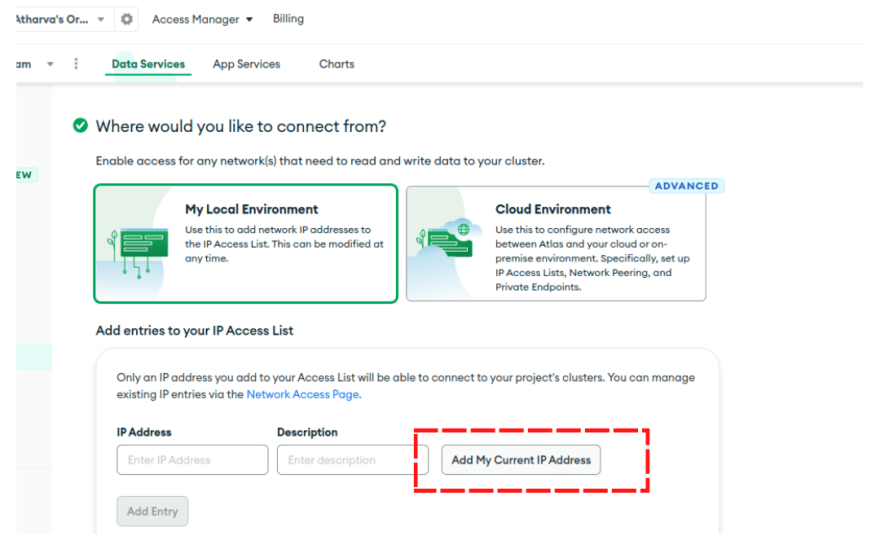
- 现在,我们将要求创建用户和密码并添加我们的本地IP地址。只需单击“添加IP地址”按钮,它的超级简单即可自动完成。
- 在几分钟之内我们的群集将被创建。
- 现在我们必须将应用程序连接到它。因此,我们将单击数据库部分右侧的连接按钮。
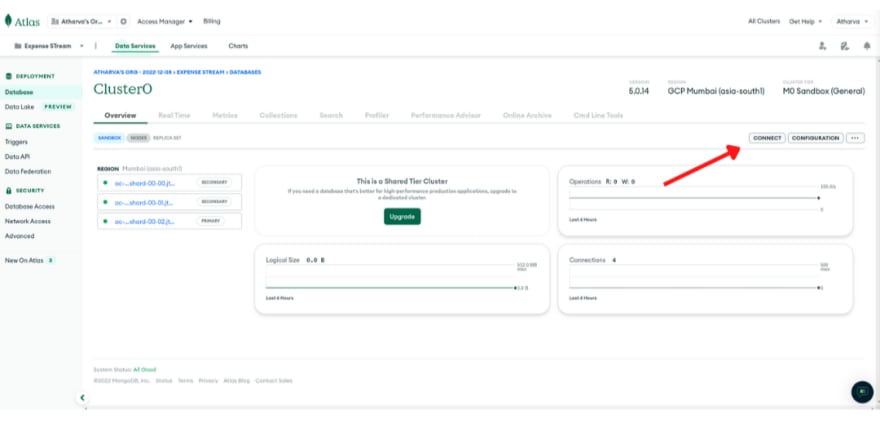
- 之后,我们将获得4个选项,我们将选择
connect your applicationOne。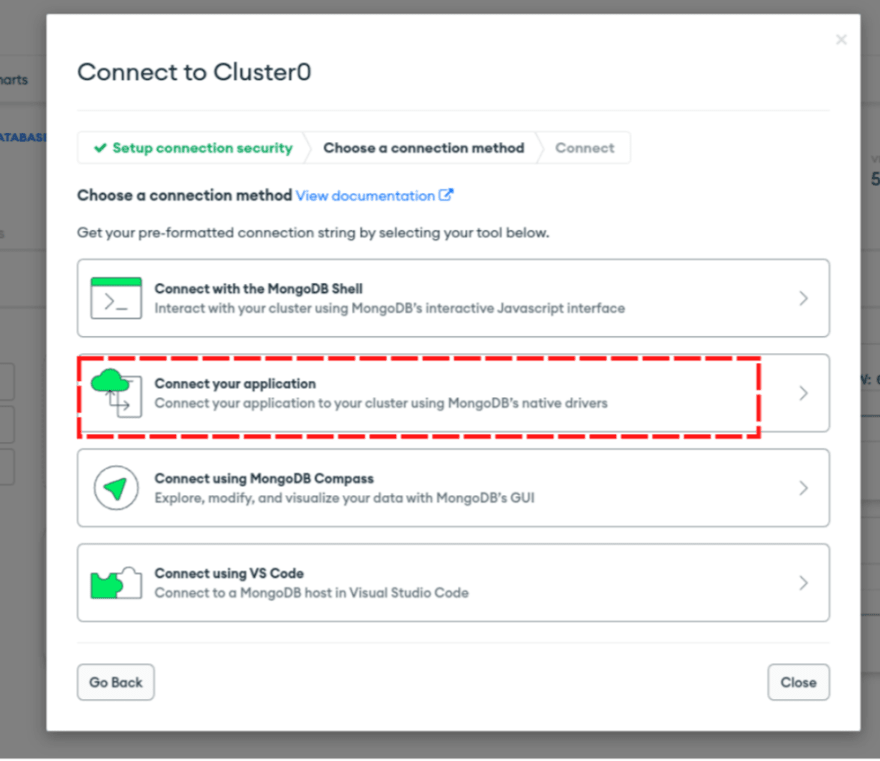
- 单击它后,我们将弹出弹出式询问我们的应用程序语言和版本。我们将选择Python,并在本地计算机上安装了版本。
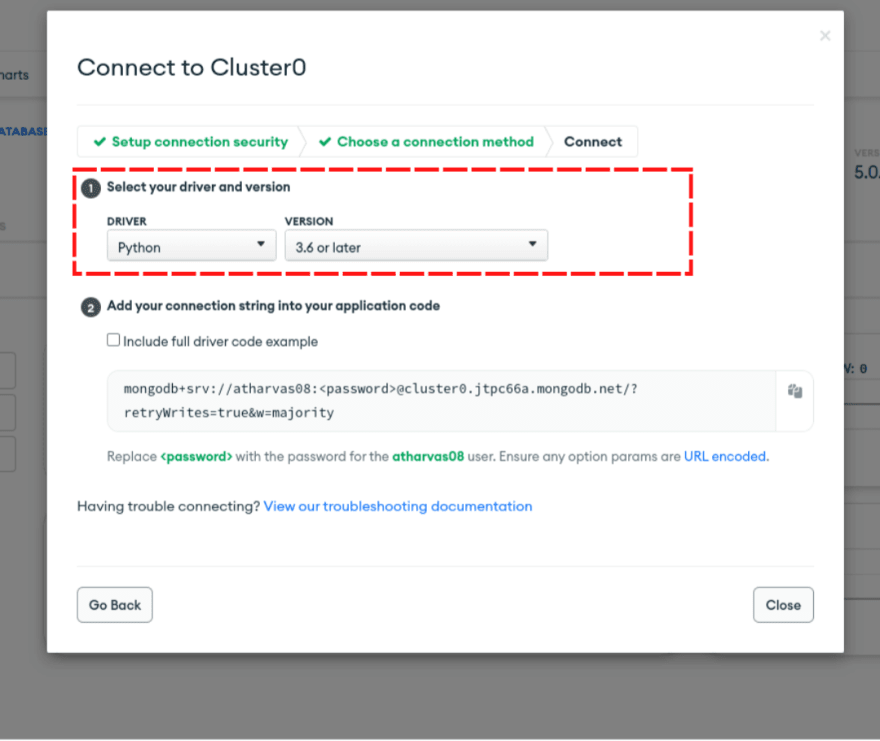
- 之后,我们将获得群集访问链接。
使用链接时,我们只需要做出一个更改。
而不是嵌入链接中,我们必须传递我们之前给出的实际密码(步骤5)。
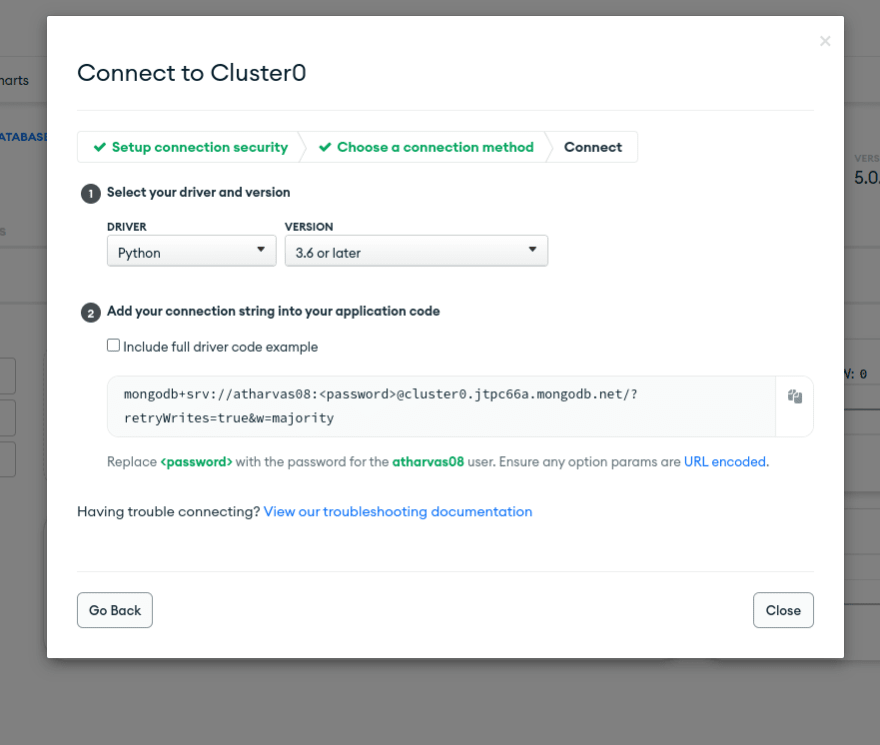 可以使用ENV变量出于安全目的传递密码。我现在直接通过它。
就是这样,我们已经完成了第一个MongoDB Atlas群集。
现在让我们在我们的应用程序中使用它。要使用它,我正在创建数据库文件,我将在其中连接到数据库并进行数据操作。
database.py文件
import pymongo
from pymongo import  MongoClient

cluster = MongoClient("mongodb+srv://atharvas08:LX8oHw8glVe5w9kJ@cluster0.jtpc66a.mongodb.net/?retryWrites=true&w=majority")

db = cluster["monthly_reports"]
collection = db["expense_data"]


#insert period as a document inside our mongodb
def insert_period(period,incomes,expenses,comment):
    return collection.insert_one({"key":period,"incomes":incomes,"expenses":expenses,"comment":comment})

def fetch_all_periods():
    res = collection.find()
    return res

def get_period(period):

    if not isinstance(period, dict):
        period = {"key": period}

    return collection.find(period)
现在让我们为我们的应用创建需求.txt文件,以便我们可以轻松地在Internet上部署。
dnspython==2.2.1
plotly==5.11.0
pymongo==4.3.3
python-dateutil==2.8.2
requests==2.28.1
streamlit==1.15.2
streamlit-option-menu==0.3.2
Dockerfile
FROM python:3.9-slim
COPY . /app
WORKDIR /app
RUN pip3 install -r requirements.txt
EXPOSE 8501
ENTRYPOINT ["streamlit", "run", "app.py", "--server.port=8501", "--server.address=0.0.0.0"]
其他资源/信息
Sankey图表/图表:
https://developers.google.com/chart/interactive/docs/gallery/sankey
mongodb atlas和pymongo doc:
https://www.mongodb.com/languages/python
