数据可视化是有抱负的数据科学家的关键技能。 matplotlib使创建有意义且有见地的情节变得容易。
在本文中,我们将看到如何构建线图,散点图,直方图并自定义它们更具视觉吸引力。
本文中使用的数据是基于World Development Indicators | DataBank的数据创建的。
线图
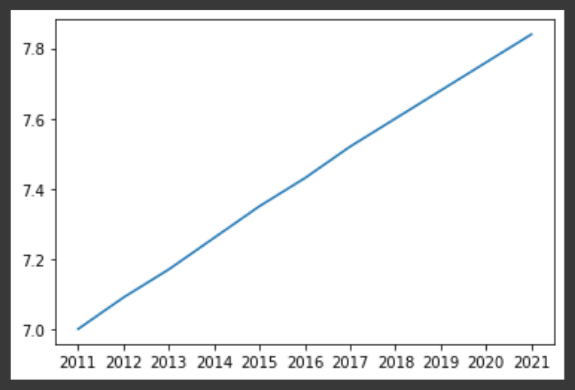
使用matplotlib,我们可以在Python中创建许多不同的图。最基本的图是线图。
示例:
import matplotlib.pyplot as plt
plt.plot(x,y)
plt.show()
-
我们必须kude1。
pyplot是matplotlib的子包装。 -
使用
plt.plot()构建线图。years将映射在水平轴上,垂直轴上的world_population_billion。 -
然后
plt.show()函数实际显示图。
years = [ '2011','2012','2013','2014','2015','2016','2017','2018','2019','2020','2021']
world_population_billion = [7, 7.09, 7.17, 7.26, 7.35, 7.43, 7.52, 7.6, 7.68, 7.76, 7.84]
# Import matplotlib.pyplot as plt
import matplotlib.pyplot as plt
print('World pouplation at', years[-1], 'is', world_population_billion[-1])
# Make a line plot: years on the x-axis, world_population_billion on the y-axis
plt.plot(years, world_population_billion)

# Display the plot with plt.show()
plt.show()
现在我们已经构建了第一行图,让我们在下一个数据上工作。
-
life_expectancy包含每个国家的预期寿命(2020)和 -
gdp_per_capita,其中包含以美元表示的每个国家/地区的人均GDP(2020)。
GDP代表国内生产总值。它基本上代表了一个国家的经济规模。将其划分为人口,您将获得人均GDP。
life_expectancy = [65.173, 78.686, 77.063, 61.487, 77.146, 76.813, 75.224, 76.434, 83.2, 81.19268293, 73.123, 74.053, 77.419, 72.868, 79.308, 74.22682927, 80.79512195, 74.754, 62.077, 72.08, 71.771, 77.545, 69.793, 76.084, 75.998, 73.60731707, 61.981, 61.916, 73.166, 70.054, 59.626, 81.74878049, 53.679, 54.505, 80.329, 77.097, 77.46, 64.525, 60.971, 64.804, 80.465, 58.104, 77.72439024, 78.892, 81.135, 78.22682927, 81.55121951, 67.49, 74.257, 77.216, 72.15, 73.533, 59.057, 78.34634146, 60.721, 66.953, 67.561, 82.13170732, 82.17560976, 77.836, 66.69, 62.383, 73.919, 80.94146341, 64.347, 81.08780488, 72.426, 80.277, 74.529, 61.962, 58.634, 70.023, 64.315, 75.448, 85.38780488, 75.61707317, 83.06585366, 69.887, 71.908, 76.87, 70.748, 82.20487805, 82.34390244, 74.586, 84.61560976, 74.655, 71.37, 66.991, 68.611, 83.42682927, 75.586, 71.8, 68.219, 75.38780488, 79.004, 54.836, 64.423, 73.082, 74.92926829, 81.74146341, 84.37, 67.39, 64.694, 76.306, 79.208, 59.692, 82.65365854, 65.129, 74.17707317, 75.131, 68.002, 72.006, 70.056, 75.93170732, 76.901, 61.387, 67.363, 64.045, 71.067, 81.4097561, 77.77117073, 82.05609756, 74.697, 62.792, 55.018, 75.69317073, 83.2097561, 78.078, 67.428, 78.68, 64.725, 74.363, 76.947, 71.36, 76.6, 80.97560976, 80.08746341, 80.363, 74.35365854, 71.33878049, 69.329, 73.45, 70.583, 75.28, 68.213, 55.066, 83.74390244, 76.86585366, 80.53170732, 73.132, 57.697, 64.379, 82.33414634, 77.144, 76.343, 72.658, 65.53, 71.802, 82.40731707, 83.1, 71.301, 65.815, 77.344, 69.712, 61.34, 71.018, 73.628, 76.891, 77.928, 63.713, 71.18512195, 78.12, 80.90243902, 77.2804878, 78.056, 71.848, 70.623, 75.493, 79.8195122, 66.181, 64.194, 61.738]
gdp_per_capita = [20116137326.0, 15131866271.0, 145000000000.0, 53619071176.0, 1370281481.0, 390000000000.0, 12641209802.0, 2496648045.0, 1330000000000.0, 433000000000.0, 42693000000.0, 9699500000.0, 34723357447.0, 374000000000.0, 4689534962.0, 61489588895.0, 522000000000.0, 1585631670.0, 15651545332.0, 2315436303.0, 36629843806.0, 19955120005.0, 14930072799.0, 1450000000000.0, 12005825770.0, 69889347433.0, 17933606353.0, 2780510625.0, 1703698677.0, 25872798012.0, 40804449726.0, 1650000000000.0, 2326720921.0, 10715396135.0, 253000000000.0, 14700000000000.0, 270000000000.0, 1223876065.0, 48716960860.0, 10483151094.0, 62158002233.0, 61348579465.0, 57203783203.0, 107000000000.0, 24692095945.0, 245000000000.0, 356000000000.0, 3181071154.0, 78844702329.0, 99291124000.0, 365000000000.0, 24638720000.0, 10099157270.0, 30650285472.0, 3984840580.0, 108000000000.0, 4574413823.0, 272000000000.0, 2630000000000.0, 5669368717.0, 15316824039.0, 1830413000.0, 15842922533.0, 3850000000000.0, 70043199814.0, 189000000000.0, 1043411111.0, 5844000000.0, 77604632621.0, 14169626010.0, 1431758243.0, 5471256595.0, 14508218017.0, 23827840810.0, 345000000000.0, 157000000000.0, 21718075725.0, 2670000000000.0, 1060000000000.0, 232000000000.0, 184000000000.0, 426000000000.0, 1890000000000.0, 13812425037.0, 5040000000000.0, 43697659296.0, 171000000000.0, 101000000000.0, 180911843.6, 1640000000000.0, 106000000000.0, 7780874537.0, 18981800705.0, 33645460617.0, 25948915861.0, 2250717718.0, 3039982540.0, 52320215472.0, 56546957475.0, 73353132794.0, 25586111076.0, 13225591804.0, 12172128470.0, 337000000000.0, 3742769967.0, 17465392779.0, 14917038504.0, 7915985514.0, 10926820603.0, 1090000000000.0, 407515928.0, 11859730544.0, 13312981595.0, 4780722122.0, 115000000000.0, 14028811072.0, 78930257227.0, 10562637376.0, 33433670512.0, 914000000000.0, 9435529927.0, 212000000000.0, 12586941393.0, 13741378450.0, 432000000000.0, 12116981815.0, 362000000000.0, 73971391417.0, 300000000000.0, 53977037000.0, 24667052023.0, 35432178068.0, 202000000000.0, 362000000000.0, 597000000000.0, 229000000000.0, 103000000000.0, 144000000000.0, 250000000000.0, 1490000000000.0, 10184345442.0, 807147527.6, 472914469.9, 703000000000.0, 24493157583.0, 4063289450.0, 345000000000.0, 105000000000.0, 53589609581.0, 1545888426.0, 6965285325.0, 335000000000.0, 1280000000000.0, 80969683537.0, 1616772748.0, 872134546.8, 26987563444.0, 2884248048.0, 541000000000.0, 752000000000.0, 8133996648.0, 62409709111.0, 500000000000.0, 1902156800.0, 7574636979.0, 488829964.1, 21392536138.0, 42514151614.0, 720000000000.0, 37600368181.0, 157000000000.0, 359000000000.0, 2760000000000.0, 20900000000000.0, 53560755047.0, 59894305353.0, 896827873.1, 343000000000.0, 4204000000.0, 18840511908.0, 18110631358.0, 18051170799.0]
- 在X轴上使用
life_expectancy构建线条图,而y轴上的gdp_per_capita。将这些数据绘制在线图上是否有意义?
# Make a line plot, gdp_per_capita on the x-axis, life_expectancy on the y-axis
plt.plot(gdp_per_capita, life_expectancy)

# Display the plot
plt.show()
好吧,这看起来不正确。让我们建立一个更有意义的情节。
散点图
当我们沿着水平轴具有时间尺度时,在大多数情况下,线图是很好的。但是在许多其他情况下,当我们试图评估两个变量之间是否存在相关性时,散点图是更好的选择。
示例:
import matplotlib.pyplot as plt
plt.scatter(x,y)
plt.show()
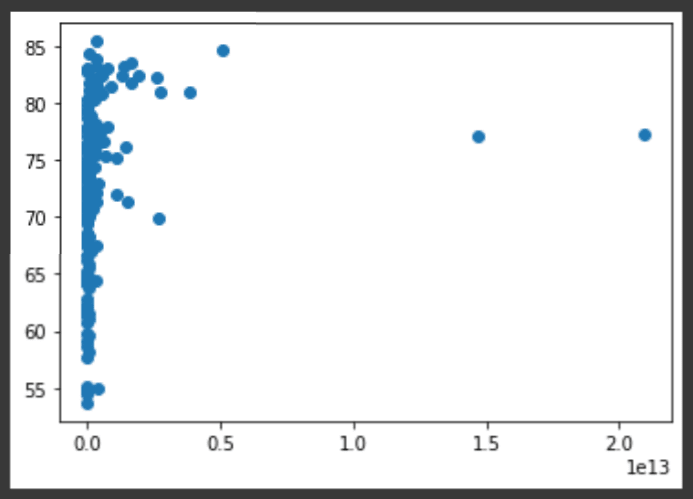
让我们继续使用gdp_per_capita与life_expectancy图,2020年不同国家 /地区的GDP和预期寿命数据。让我们看看是否有更好的选择?
# Use a scatter plot
plt.scatter(gdp_per_capita, life_expectancy)

# Show plot
plt.show()
太好了!在这种情况下,散点图看起来比线图好得多。
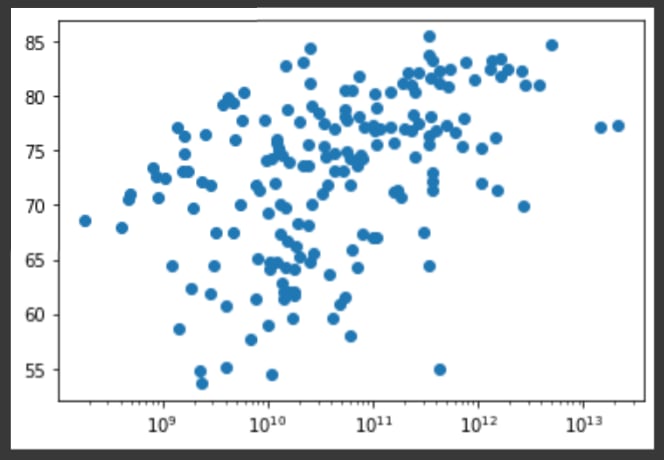
- 当我们使用
plt.xscale('log')以对数刻度显示人均GDP时,相关性将变得明确。
# Use a scatter plot
plt.scatter(gdp_per_capita, life_expectancy)

# Put the x-axis on a logarithmic scale
plt.xscale('log')

# Show plot
plt.show()
看起来较高的GDP通常对应于较高的预期寿命。一个国家的人口与预期寿命之间存在关系吗?
population = [38928341.0, 2837849.0, 43851043.0, 32866268.0, 97928.0, 45376763.0, 2963234.0, 106766.0, 25693267.0, 8916864.0, 10093121.0, 393248.0, 1701583.0, 164689383.0, 287371.0, 9379952.0, 11544241.0, 397621.0, 12123198.0, 771612.0, 11673029.0, 3280815.0, 2351625.0, 212559409.0, 437483.0, 6934015.0, 20903278.0, 11890781.0, 555988.0, 16718971.0, 26545864.0, 38037204.0, 4829764.0, 16425859.0, 19116209.0, 1411100000.0, 50882884.0, 869595.0, 89561404.0, 5518092.0, 5094114.0, 26378275.0, 4047680.0, 11326616.0, 1207361.0, 10697858.0, 5831404.0, 988002.0, 10847904.0, 17643060.0, 102334403.0, 6486201.0, 1402985.0, 1329479.0, 1160164.0, 114963583.0, 896444.0, 5529543.0, 67379908.0, 280904.0, 2225728.0, 2416664.0, 3722716.0, 83160871.0, 31072945.0, 10700556.0, 112519.0, 168783.0, 16858333.0, 13132792.0, 1967998.0, 786559.0, 11402533.0, 9904608.0, 7481000.0, 9750149.0, 366463.0, 1380004385.0, 273523621.0, 83992953.0, 40222503.0, 4985674.0, 59449527.0, 2961161.0, 126261000.0, 10203140.0, 18755666.0, 53771300.0, 119446.0, 51836239.0, 4270563.0, 6579900.0, 7275556.0, 1900449.0, 6825442.0, 2142252.0, 5057677.0, 6871287.0, 2794885.0, 630419.0, 649342.0, 27691019.0, 19129955.0, 32365998.0, 540542.0, 20250834.0, 515332.0, 4649660.0, 1265740.0, 128932753.0, 115021.0, 2620495.0, 3278292.0, 621306.0, 36910558.0, 31255435.0, 54409794.0, 2540916.0, 29136808.0, 17441500.0, 271960.0, 5090200.0, 6624554.0, 24206636.0, 206139587.0, 2072531.0, 5379475.0, 5106622.0, 220892331.0, 4314768.0, 8947027.0, 7132530.0, 32971846.0, 109581085.0, 37899070.0, 10297081.0, 3281538.0, 2881060.0, 19257520.0, 144073139.0, 12952209.0, 198410.0, 219161.0, 34813867.0, 16743930.0, 7976985.0, 5685807.0, 5458827.0, 2102419.0, 686878.0, 15893219.0, 59308690.0, 47363419.0, 21919000.0, 183629.0, 110947.0, 43849269.0, 586634.0, 10353442.0, 8636561.0, 9537642.0, 59734213.0, 69799978.0, 1318442.0, 8278737.0, 105697.0, 1399491.0, 11818618.0, 84339067.0, 45741000.0, 44132049.0, 9890400.0, 67081000.0, 331501080.0, 3473727.0, 34232050.0, 307150.0, 97338583.0, 106290.0, 29825968.0, 18383956.0, 14862927.0]

# Build Scatter plot
plt.scatter(population, life_expectancy)

# Show plot
plt.show()
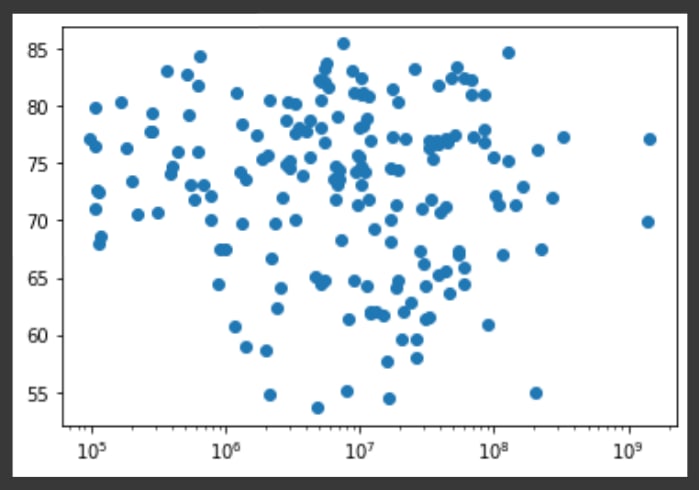
让我们以对数刻度查看带有X轴的图。
# Build Scatter plot
plt.scatter(population, life_expectancy)

# Put the x-axis on a logarithmic scale
plt.xscale('log')

# Show plot
plt.show()
人口与预期寿命之间没有明确的关系,这是完全合理的。
直方图
直方图是一种可视化的类型,可用于探索数据非常有用。它可以帮助您了解我们变量的分布。
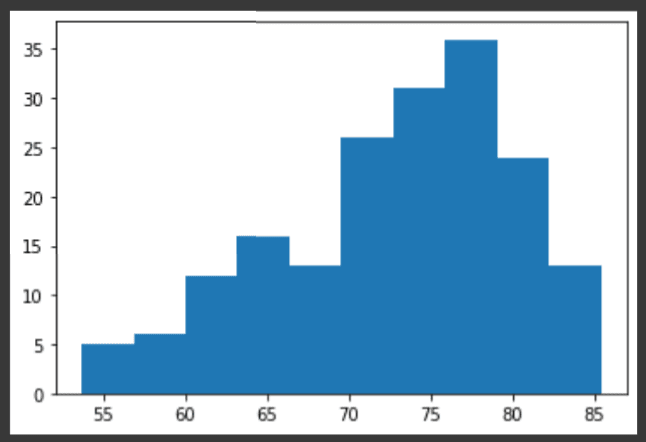
要查看不同国家 /地区的预期寿命如何分布,让我们使用plt.hist()创建life_expectancy的直方图。
# Create histogram of life_expectancy data
plt.hist(life_expectancy)

# Display histogram
plt.show()
在上面的代码中,我们没有指定垃圾箱的数量。默认情况下,Python将垃圾箱的数量设置为10。垃圾箱的数量非常重要。
- 太少的垃圾箱会过分简化现实,不会向您显示细节。
- 太多的垃圾箱会胜过现实,不会显示大图。
要控制将数据划分的垃圾箱的数量,您可以设置bins参数。
我们将创建两个指定bins的图。
- 构建带有5个箱的
life_expectancy的直方图。您能说出哪个垃圾箱包含最多的观察结果?
# Build histogram with 5 bins
plt.hist(life_expectancy, bins=5)

# Show and clean up plot
plt.show()
- 这次用20个垃圾箱构建了
life_expectancy的另一个直方图。这是否更好?
# Build histogram with 20 bins
plt.hist(life_expectancy, bins=20)

# Show and clean up again
plt.show()
使用直方图比较
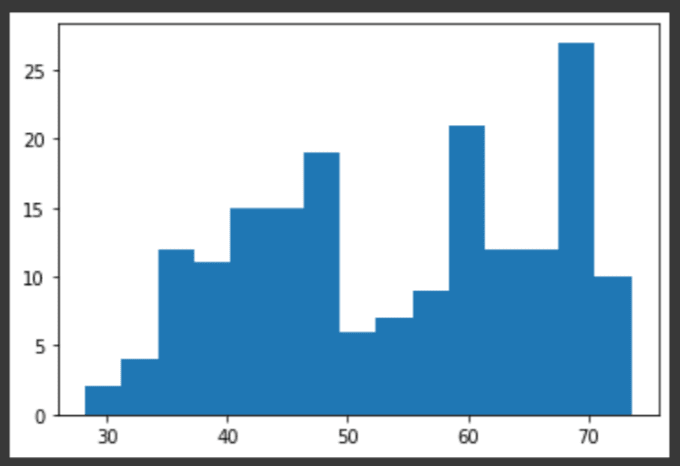
直方图有助于进行比较。 life_expectancy在2020年包含不同国家/地区的预期数据。life_expectancy_1960,包含1960年的类似数据。让我们为两个数据集做一个直方图。
- 构建用15箱的
life_expectancy的直方图。 - 构建
life_expectancy_1960的直方图,也有15个垃圾箱。
,让我们看看有任何模式吗?
life_expectancy_1960 = [32.446, 62.283, 46.141, 37.524, 61.968, 65.055, 65.972, 65.662, 70.81707317, 68.58560976, 61.034, 64.74, 51.869, 45.379, 64.472, 67.70809756, 69.70195122, 59.981, 37.271, 34.526, 41.82, 60.353, 49.179, 54.143, 54.81, 69.24756098, 34.432, 41.281, 48.461, 41.242, 41.785, 71.13317073, 36.249, 38.02, 57.219, 43.725, 57.269, 41.447, 41.098, 45.721, 60.381, 36.095, 64.60865854, 63.834, 69.618, 70.34878049, 72.17658537, 44.038, 51.602, 52.982, 48.042, 49.95, 36.535, 67.90290244, 43.572, 38.419, 60.811, 68.8197561, 69.86829268, 56.282, 39.694, 32.054, 63.651, 69.31002439, 45.843, 68.16390244, 62.231, 60.97, 46.702, 34.89, 37.478, 60.26, 41.762, 46.274, 66.96168293, 68.00317073, 73.42317073, 41.422, 46.664, 44.947, 48.022, 69.7965122, 69.12390244, 64.77, 67.66609756, 52.651, 58.36758537, 46.76, 47.061, 55.41553659, 59.343, 56.12807317, 43.204, 69.78682927, 63.267, 47.919, 34.264, 42.609, 69.84731707, 68.44639024, 64.828, 39.962, 36.672, 59.991, 37.343, 28.199, 69.4332439, 44.432, 58.74521951, 57.077, 54.513, 61.995, 48.392, 63.70560976, 48.458, 39.439, 42.381, 46.483, 35.583, 73.39268293, 58.63902439, 71.23658537, 46.998, 35.053, 36.976, 60.62280488, 73.5497561, 42.672, 45.299, 60.864, 38.935, 63.881, 48.012, 61.105, 67.6804878, 63.27290244, 68.71960976, 61.094, 65.64243902, 66.05529268, 42.616, 56.902, 50.378, 45.638, 38.223, 31.566, 65.65982927, 69.92365854, 68.97804878, 48.123, 36.976, 48.406, 69.10926829, 59.369, 56.739, 59.26, 48.194, 59.682, 73.00560976, 71.31341463, 50.613, 43.6, 54.701, 33.729, 40.297, 59.885, 62.222, 42.021, 45.369, 44.359, 68.29953659, 51.537, 71.12682927, 69.77073171, 67.783, 58.835, 48.975, 59.039, 66.22485366, 29.919, 46.687, 53.019]

# Histogram of life_expectancy_1960, 15 bins
plt.hist(life_expectancy_1960, bins=15)

# Show and clear plot
plt.show()
# Histogram of life_expectancy, 15 bins
plt.hist(life_expectancy, bins=15)

# Show and clear plot
plt.show()
通过比较2个直方图,我们可以看到,与2020年的大部分预期相比,1960年的大部分预期都较低。
随着世界在卫生保健系统中的更先进,预期的期望会变成危险吗?
定制图
创建情节很棒。使消息非常清楚地制作正确的情节是真正的挑战。
对于每个可视化,我们都有许多选择。首先,有不同的图类型。对于每个图,您可以进行无限数量的自定义。
您可以更改
- 颜色,
- shapes,
- 标签,
- 轴,依此类推。
选择取决于
- 数据和
- 您想通过数据讲述的故事。
有很多可能的自定义。让我们看一下我们编写的代码脚本,该脚本从2011年到2021年构建了世界人口的简单线。
# Make a line plot: years on the x-axis, world_population_billion on the y-axis
plt.plot(years, world_population_billion)

# Display the plot with plt.show()
plt.show()
我们已经得到了一个很好的情节,但是有些事情可以改善。应该清楚我们要显示哪些数据,尤其是第一次看到图形的人。
标记轴
您总是需要做的第一件事就是标记轴。
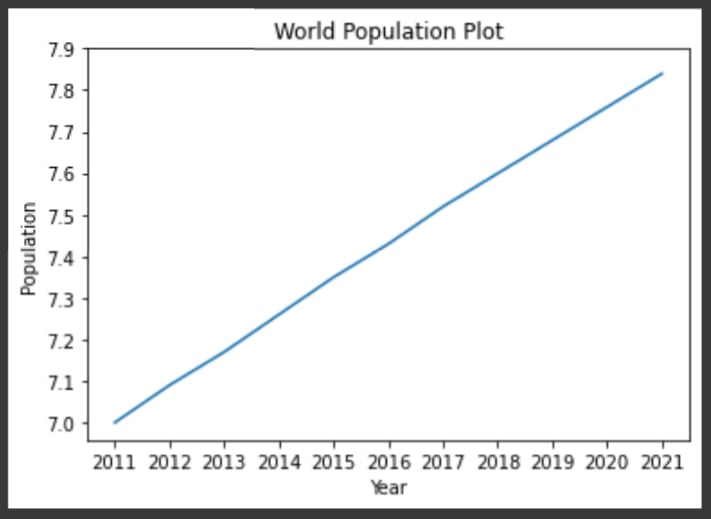
让我们通过添加xlabel和ylabel函数来做到这一点。作为输入,我们通过应将其放置在轴旁边的字符串。我们必须在调用show函数之前调用这些功能,否则我们的自定义将不会显示。
# Make a line plot: years on the x-axis, world_population_billion on the y-axis
plt.plot(years, world_population_billion)

plt.xlabel('Year')
plt.ylabel('Population')

# Display the plot with plt.show()
plt.show()
添加标题
我们还将使用title函数在图中添加标题。我们将实际标题“世界人口情节”作为论点。
# Make a line plot: years on the x-axis, world_population_billion on the y-axis
plt.plot(years, world_population_billion)

plt.xlabel('Year')
plt.ylabel('Population')
plt.title('World Population Plot')

# Display the plot with plt.show()
plt.show()
现在,我们可以为读者提供有关图上数据的更多信息,并说明该图的内容。
tick
我们还可以自定义y轴。我们可以使用yticks函数来执行此操作。首先指定ytick位置的列表。
# Make a line plot: years on the x-axis, world_population_billion on the y-axis
plt.plot(years, world_population_billion)

plt.xlabel('Year')
plt.ylabel('Population')
plt.title('World Population Plot')

plt.yticks(ticks=[7,7.1,7.2,7.3,7.4,7.5,7.6,7.7,7.8,7.9,],)

# Display the plot with plt.show()
plt.show()
重新插入在我们指定的位置上完全显示滴答。
我们想清楚地表明我们正在谈论数十亿美元,我们可以在yticks函数中添加第二个参数,该函数是带有tick的显示名称的列表。此列表(标签)的长度应与第一个列表(ticks)相同。
# Make a line plot: years on the x-axis, world_population_billion on the y-axis
plt.plot(years, world_population_billion)

plt.xlabel('Year')
plt.ylabel('Population')
plt.title('World Population Plot')

plt.yticks(ticks=[7,7.1,7.2,7.3,7.4,7.5,7.6,7.7,7.8,7.9, ],
           labels=['7 B','7.1 B','7.2 B','7.3 B','7.4 B','7.5 B','7.6 B','7.7 B','7.8 B','7.9 B', ])

# Display the plot with plt.show()
plt.show()
标签发生了相应的变化。太棒了!
尺寸
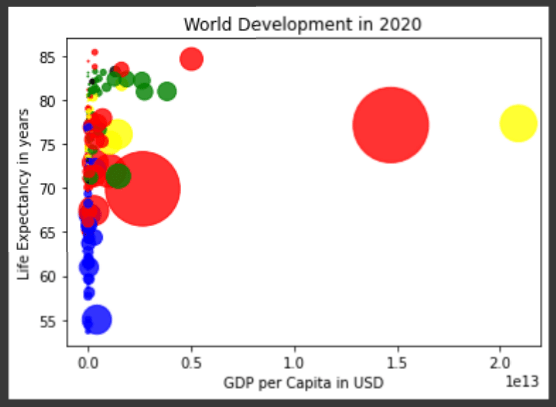
我们已经看到,散点图只是蓝色点的云,彼此无法区分。如果我们可以设置点的大小与人口相对应,那不是很好吗?我们可以通过使用参数s进行大小来做到这一点。 dot_size_list是一个列表,包含每个国家人口的每个点的大小。
dot_size_list = [item*2/1000000 for item in population]

plt.scatter(gdp_per_capita, life_expectancy, s = dot_size_list)

# plt.xscale('log')
plt.xlabel('GDP per Capita in USD')
plt.ylabel('Life Expectancy in years')
plt.title('World Development in 2020')

# Display the plot
plt.show()
现在这些点有自己的尺寸,但情节仍然很难观察。
颜色
接下来,我们将使情节更加丰富多彩!
dot_color是每个相应国家的颜色的清单,具体取决于该国的一部分。 dot_color已经使用以下continent_colors映射为每个国家 /地区创建。
continent_colors = {
    'Asia':'red',
    'Europe':'green',
    'Africa':'blue',
    'Americas':'yellow',
    'Oceania':'black'
}
- 将
c = dot_color添加到plt.scatter()函数的参数中。 - 通过将
alpha参数设置为plt.scatter()内的0.8来更改气泡的不透明度。 α可以从零设置为一个,其中零是完全透明的,并且根本不透明。
dot_color = ['red', 'green', 'blue', 'blue', 'yellow', 'yellow', 'red', 'yellow', 'black', 'green', 'red', 'yellow', 'red', 'red', 'yellow', 'green', 'green', 'yellow', 'blue', 'red', 'yellow', 'green', 'blue', 'yellow', 'red', 'green', 'blue', 'blue', 'blue', 'red', 'blue', 'yellow', 'blue', 'blue', 'yellow', 'red', 'yellow', 'blue', 'blue', 'blue', 'yellow', 'blue', 'green', 'yellow', 'red', 'green', 'green', 'blue', 'yellow', 'yellow', 'blue', 'yellow', 'blue', 'green', 'blue', 'blue', 'black', 'green', 'green', 'black', 'blue', 'blue', 'red', 'green', 'blue', 'green', 'yellow', 'black', 'yellow', 'blue', 'blue', 'yellow', 'yellow', 'yellow', 'red', 'green', 'green', 'red', 'red', 'red', 'red', 'green', 'green', 'yellow', 'red', 'red', 'red', 'blue', 'black', 'red', 'red', 'red', 'red', 'green', 'red', 'blue', 'blue', 'blue', 'green', 'green', 'red', 'blue', 'blue', 'red', 'red', 'blue', 'green', 'blue', 'blue', 'yellow', 'black', 'green', 'red', 'green', 'blue', 'blue', 'red', 'blue', 'red', 'green', 'black', 'black', 'yellow', 'blue', 'blue', 'green', 'green', 'red', 'red', 'yellow', 'black', 'yellow', 'yellow', 'red', 'green', 'green', 'yellow', 'red', 'green', 'green', 'blue', 'black', 'blue', 'red', 'blue', 'blue', 'red', 'green', 'green', 'black', 'blue', 'blue', 'green', 'red', 'yellow', 'yellow', 'blue', 'yellow', 'green', 'green', 'red', 'blue', 'red', 'red', 'blue', 'black', 'yellow', 'blue', 'red', 'blue', 'green', 'red', 'green', 'yellow', 'yellow', 'red', 'black', 'red', 'yellow', 'red', 'blue', 'blue']

# Specify c and alpha inside plt.scatter()
plt.scatter(gdp_per_capita, life_expectancy, s = dot_size_list, c=dot_color, alpha=0.8)

# Previous customizations
plt.xlabel('GDP per Capita in USD')
plt.ylabel('Life Expectancy in years')
plt.title('World Development in 2020')

# Show the plot
plt.show()
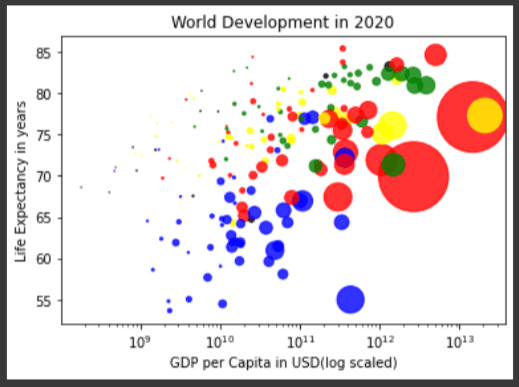
让我们将X轴缩放到日志中以获取另一个观点。
# Specify c and alpha inside plt.scatter()
plt.scatter(gdp_per_capita, life_expectancy, s = dot_size_list, c=dot_color, alpha=0.8)

# Previous customizations
plt.xscale('log')
plt.xlabel('GDP per Capita in USD(log scaled)')
plt.ylabel('Life Expectancy in years')
plt.title('World Development in 2020')

# Show the plot
plt.show()
有趣。我们可以在该图中更清楚地看到该图,并使用log缩放的x轴。
在图上显示文字
现在,我们将通过将x,y位置指定为使用text函数的参数来显示在图上的文本。
# Specify c and alpha inside plt.scatter()
plt.scatter(gdp_per_capita, life_expectancy, s = dot_size_list, c=dot_color, alpha=0.8)

# Previous customizations
plt.xscale('log')
plt.xlabel('GDP per Capita in USD(log scaled)')
plt.ylabel('Life Expectancy in years')
plt.title('World Development in 2020')

# China
plt.text(1.470000e+13, 77.097, 'CHN')
# United state
plt.text(2.090000e+13, 77.280488, 'USA')
# Myanmar
plt.text(7.893026e+10, 67.363, 'MMR')

# Show the plot
plt.show()
看来我们需要自定义图的大小以获得更好的视图。
图大小
我们可以通过在plt.figure()中指定figsize=[Width inches, height inches]来做到这一点。
plt.figure(figsize=[14,6])
# Specify c and alpha inside plt.scatter()
plt.scatter(gdp_per_capita, life_expectancy, s = dot_size_list, c=dot_color, alpha=0.8)

# Previous customizations
plt.xscale('log')
plt.xlabel('GDP per Capita in USD(log scaled)')
plt.ylabel('Life Expectancy in years')
plt.title('World Development in 2020')

# China
plt.text(1.470000e+13, 77.097, 'CHN')
# United state
plt.text(2.090000e+13, 77.280488, 'USA')
# Myanmar
plt.text(7.893026e+10, 67.363, 'MMR')

# Show the plot
plt.show()
在这里,我们注意到,位于非洲的蓝色国家的预期寿命较低,人均GDP较低。
美丽!可视化只有在我们可以正确解释时才有意义。
在本文中,我们学会了如何使用matplotlib绘制线路,分散,直方图以及如何自定义它们。
Connect & Discuss with us on LinkedIn


