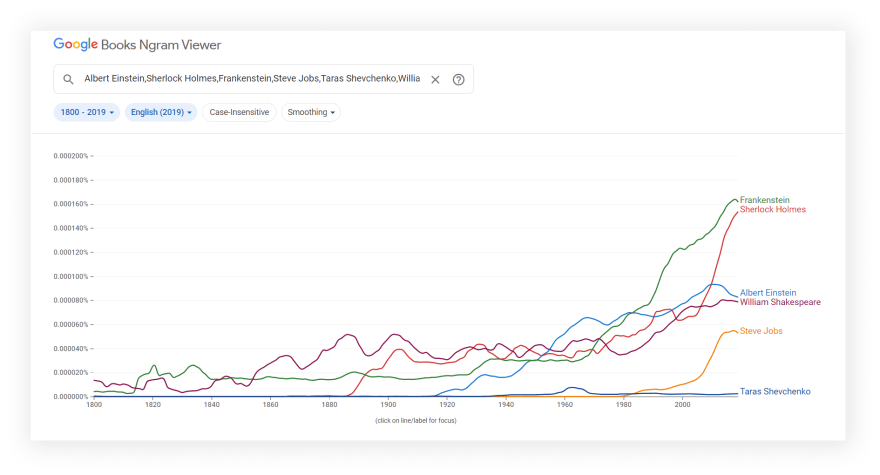
Intro
目前,我们没有支持从Google Books ngram Viewer页面中提取数据的API。
这篇博客文章是为了向您展示如何使用下面提供的DIY解决方案自己完成的方式,而我们正在释放适当的API。
该解决方案可用于个人使用,因为它不包括我们为付费的production and above plans提供的Legal US Shield,并且有其限制,例如需要绕过块,例如Captcha。
您可以检查我们的公共路线图以跟踪此API的进度:
将被刮擦
与刮擦数据图进行比较:
完整代码
const axios = require("axios");
const fs = require("fs");
const { ChartJSNodeCanvas } = require("chartjs-node-canvas");

const searchString = "Albert Einstein,Sherlock Holmes,Frankenstein,Steve Jobs,Taras Shevchenko,William Shakespeare"; // what we want to get
const startYear = 1800; // the start year of the search
const endYear = 2019; // the end year of the search

const AXIOS_OPTIONS = {
  headers: {
    "User-Agent": "Mozilla/5.0 (Windows NT 10.0; Win64; x64) AppleWebKit/537.36 (KHTML, like Gecko) Chrome/101.0.4951.64 Safari/537.36",
  }, // adding the User-Agent header as one way to prevent the request from being blocked
  params: {
    content: searchString, // what we want to search
    year_start: startYear, // parameter defines the start year of the search
    year_end: endYear, // parameter defines the end year of the search
  },
};

async function saveChart(chartData) {
  const width = 1920; //chart width in pixels
  const height = 1080; //chart height in pixels
  const backgroundColour = "white"; // Uses https://www.w3schools.com/tags/canvas_fillstyle.asp
  const chartJSNodeCanvas = new ChartJSNodeCanvas({ width, height, backgroundColour });

  const labels = new Array(endYear - startYear + 1).fill(startYear).map((el, i) => (el += i));

  const configuration = {
    type: "line", // for line chart
    data: {
      labels,
      datasets: chartData?.map((el) => {
        const data = el.timeseries.map((el) => el * 100);
        return {
          label: el.ngram,
          data,
          borderColor: [`rgb(${parseInt(Math.random() * 255)}, ${parseInt(Math.random() * 255)}, ${parseInt(Math.random() * 255)})`],
        };
      }),
    },
    options: {
      scales: {
        y: {
          title: {
            display: true,
            text: "%",
          },
        },
      },
    },
  };

  const base64Image = await chartJSNodeCanvas.renderToDataURL(configuration);

  const base64Data = base64Image.replace(/^data:image\/png;base64,/, "");

  fs.writeFile("chart.png", base64Data, "base64", function (err) {
    if (err) {
      console.log(err);
    }
  });
}

function getChart() {
  return axios.get(`https://books.google.com/ngrams/json`, AXIOS_OPTIONS).then(({ data }) => data);
}

getChart().then(saveChart);
准备
首先,我们需要创建一个node.js* project并添加koude0软件包koude1以向网站提出请求,以从接收到的数据和koude3构建图表,以使用koude4。
为此,在我们项目的目录中,打开命令行并输入:
$ npm init -y
,然后:
$ npm i axios chart.js chartjs-node-canvas
*如果您没有安装node.js,则可以download it from nodejs.org并遵循安装documentation。
Process
我们将以JSON格式接收书籍ngram数据,因此我们只需要处理收到的数据,并创建自己的图表(如果需要):
请求:
axios.get(`https://books.google.com/ngrams/json`, AXIOS_OPTIONS).then(({ data }) => data);
响应json:
[
  {
    "ngram": "Albert Einstein",
    "parent": "",
    "type": "NGRAM",
    "timeseries": [
      0, 0, 0, 0, 0, 0, 0, 0, 0, 0, 0, 0, 0, 0, 0, 0, 9.077474010561153e-10, 9.077474010561153e-10, 9.077474010561153e-10,
      ...and other chart data
      ]
  },
  {
    "ngram": "Sherlock Holmes",
    "parent": "",
    "type": "NGRAM",
    "timeseries": [
      4.731798064483428e-9, 3.785438451586742e-9, 3.154532042988952e-9, 2.7038846082762446e-9, 0, 2.47730296593878e-10,
      ...and other chart data
    ]
  },
  ...and other Books Ngram data
]
代码说明
从koude1,koude6声明常数(fs库允许您使用计算机上的文件系统)和koude3库:
const axios = require("axios");
const fs = require("fs");
const { ChartJSNodeCanvas } = require("chartjs-node-canvas");
接下来,我们写我们想要获得的东西,年结束年开始:
const searchString = "Albert Einstein,Sherlock Holmes,Frankenstein,Steve Jobs,Taras Shevchenko,William Shakespeare";
const startYear = 1800;
const endYear = 2019;
接下来,我们编写一个请求选项:用koude10的koude9,用于用作“真实”用户访问,以及用于提出请求的必要参数。
Default koude1 request user-agent is koude12因此,网站了解这是一个发送请求并可能阻止它的脚本。 Check what's your user-agent:
const AXIOS_OPTIONS = {
  headers: {
    "User-Agent": "Mozilla/5.0 (Windows NT 10.0; Win64; x64) AppleWebKit/537.36 (KHTML, like Gecko) Chrome/101.0.4951.64 Safari/537.36",
  }, // adding the User-Agent header as one way to prevent the request from being blocked
  params: {
    content: searchString, // what we want to search
    year_start: startYear, // parameter defines the start year of the search
    year_end: endYear, // parameter defines the end year of the search
  },
};
接下来,我们编写一个函数,该函数处理并保存收到的数据到“ .png”文件:
async function saveChart(chartData) {
    ...
}
在此功能中,我们需要声明koude4 width,height和backgroundColor,然后使用koude3构建它:
const width = 1920; //chart width in pixels
const height = 1080; //chart height in pixels
const backgroundColour = "white"; // Uses https://www.w3schools.com/tags/canvas_fillstyle.asp
const chartJSNodeCanvas = new ChartJSNodeCanvas({ width, height, backgroundColour });
然后,我们需要定义并创建“ x”轴标签。为此,我们需要创建一个new array,其长度等于从startYear到endYear的年数(我们添加1',因为我们还需要包括这些年)。
然后,我们koude20带有startYear的数组,然后将元素位置(i)添加到每个值(使用koude23方法):
const labels = new Array(endYear - startYear + 1)
  .fill(startYear)
  .map((el, i) => (el += i));
接下来,我们需要为koude2库创建configuration对象。在此对象中,我们定义图表type,data和options。
在图表data中,我们定义了主轴labels,并从接收到的chartData中制作datasets,其中我们为每个行标签,数据和随机颜色设置(使用koude33和koude34方法)。
在图表options中,我们设置了'y'轴名称并允许显示(display属性):
const configuration = {
  type: "line", // for line chart
  data: {
    labels,
    datasets: chartData?.map((el) => {
      const data = el.timeseries.map((el) => el * 100);
      return {
        label: el.ngram,
        data,
        borderColor: [`rgb(${parseInt(Math.random() * 255)}, ${parseInt(Math.random() * 255)}, ${parseInt(Math.random() * 255)})`],
      };
    }),
  },
  options: {
    scales: {
      y: {
        title: {
          display: true,
          text: "%",
        },
      },
    },
  },
};
接下来,我们等待在koude37编码中构建图表,从base64 String(koude39方法)中删除数据类型属性,然后使用koude40方法保存“ Chart.png”文件:
const base64Image = await chartJSNodeCanvas.renderToDataURL(configuration);

const base64Data = base64Image.replace(/^data:image\/png;base64,/, "");

fs.writeFile("chart.png", base64Data, "base64", function (err) {
  if (err) {
    console.log(err);
  }
});
然后,我们编写一个函数,该函数使请求并返回接收到的数据。我们收到了koude1请求的响应,该请求具有我们destructured的data键,然后返回:
function getChart() {
  return axios
    .get(`https://books.google.com/ngrams/json`, AXIOS_OPTIONS)
    .then(({ data }) => data);
}
最后,我们需要运行我们的功能:
getChart().then(saveChart);
现在我们可以启动我们的解析器:
$ node YOUR_FILE_NAME # YOUR_FILE_NAME is the name of your .js file
保存文件
如果您想查看一些用serpapi制定的项目,write me a message。
添加一个Feature Requestð«或Bugð

